Amsterdam has a reputation for launching smart city pilots that feel less like tech demos and more like genuine neighbourhood experiments. From sensors that monitor canal water levels to street lamps that dim when nobody is around, the city runs dozens of trials every year. But here is the question that keeps urban planners and policy makers up at night: how do you measure whether these pilots actually improve people’s lives?
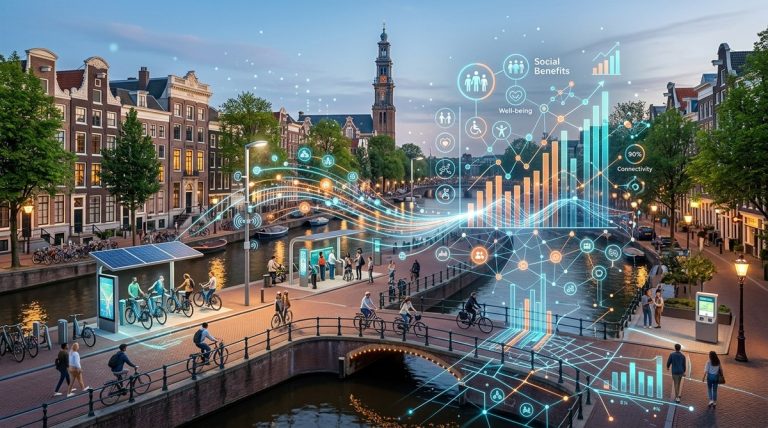
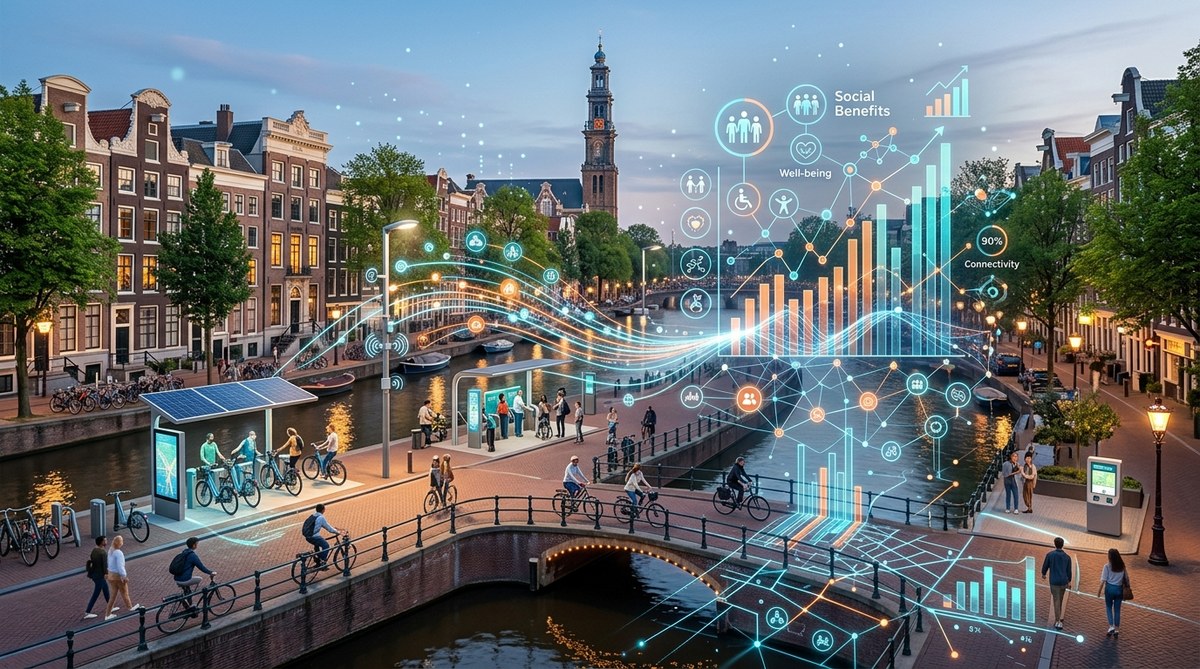
Amsterdam measures social impact through a structured framework that blends quantitative data with lived experience. The city uses five core dimensions: wellbeing, equity, resilience, participation, and sustainability. Each pilot is scored against these dimensions using a mix of sensor data, citizen surveys, and ethnographic observation. The result is a balanced scorecard that reveals whether a project truly serves the community.
Why traditional metrics fall short in smart city pilots
Most smart city projects report on technical outputs. Number of sensors deployed. Kilowatts saved. Traffic flow improvements. These figures are useful, but they miss something important. A pilot can reduce energy consumption by 20 per cent and still make residents feel anxious, excluded, or unsafe.
Amsterdam learned this lesson the hard way. In the early days of its smart city programme, several high-profile pilots showed excellent technical results but low citizen satisfaction. Residents complained about data privacy, confusing interfaces, and a sense that decisions were being made without their input. The city realised that social impact cannot be inferred from technical data alone. It must be measured directly.
The Amsterdam Social Impact Framework
In 2026, Amsterdam uses a consistent methodology called the Social Impact Framework. It was developed in collaboration with urban researchers at the University of Amsterdam and tested across more than forty pilots in districts like Nieuw-West, Zuidoost, and Centrum.
The framework breaks social impact into five dimensions:
- Wellbeing – Does the pilot make residents feel healthier, safer, or happier?
- Equity – Does it benefit all demographic groups equally, or does it favour the already privileged?
- Resilience – Does it help the neighbourhood cope with shocks like flooding, heatwaves, or economic disruption?
- Participation – Do residents have genuine influence over how the pilot is designed and run?
- Sustainability – Does the pilot reduce environmental harm without creating new social problems?
Each dimension is scored on a scale from 1 to 5. A pilot must achieve a minimum score of 3 in every dimension to be considered for scaling. If it scores high on sustainability but low on equity, the city sends it back for redesign.
A practical process for measuring social impact
If you are an urban planner looking to replicate this approach, here is the step by step process that Amsterdam teams follow:
-
Define the intended social outcome before the pilot begins. Write a one page theory of change that links the technology to a specific human benefit. For example: “If we install smart benches with air quality sensors, then elderly residents will feel more confident sitting in the park, which will reduce social isolation.”
-
Select at least two measurement methods for each dimension. Do not rely on a single source. Combine quantitative data from sensors with qualitative data from interviews. Amsterdam often uses a “three lens” approach: sensor logs, household surveys, and focus groups.
-
Collect baseline data at least four weeks before launch. You cannot measure change if you do not know the starting point. Amsterdam requires baseline surveys for every pilot that involves human behaviour.
-
Run the pilot for a minimum of three months. Shorter periods produce unreliable results. Seasonal effects, novelty bias, and teething problems all distort early data.
-
Measure again at the midpoint and at the end. Compare the scores. Look for unexpected outcomes, both positive and negative.
-
Hold a community feedback session before writing the final report. Present the raw findings to residents and ask: does this match your experience? Their corrections often change the final score.
Common mistakes and how Amsterdam avoids them
Even experienced teams make errors when measuring social impact. The table below shows the most frequent mistakes and the Amsterdam approach to each one.
| Mistake | Why it happens | Amsterdam’s fix |
|---|---|---|
| Confusing activity with outcome | A team reports “500 people attended a workshop” as a success. Attendance is an activity, not an outcome. | Require teams to state the intended outcome before launch. “500 people attended” is not a score on the wellbeing dimension. |
| Sampling only the enthusiasts | Pilots attract early adopters who are already positive. Their feedback skews results. | Use stratified sampling by age, income, and digital literacy. Over recruit from groups that are harder to reach. |
| Ignoring negative side effects | A smart parking system reduces congestion but pushes traffic into residential side streets. | The equity dimension catches this. If one group benefits at another’s expense, the pilot is redesigned. |
| Measuring too late | Teams collect feedback after the pilot ends, missing real time reactions. | Embed short pulse surveys into the pilot itself. A simple “how did that feel?” notification on an app can capture immediate sentiment. |
“We used to treat social impact as a box ticking exercise at the end of a project. Now we treat it as a design constraint from day one. It changes everything.” – Senior policy advisor, Amsterdam Smart City office
Real example: the smart bench pilot in Osdorp
To see the framework in action, consider the smart bench pilot in Osdorp, a neighbourhood in Amsterdam Nieuw-West. The pilot installed ten solar powered benches with USB charging ports and air quality displays. The technical team reported excellent results: 98 per cent uptime, 40 per cent reduction in local air quality complaints.
But the Social Impact Framework told a different story.
The wellbeing score was high. Elderly residents reported feeling safer because the benches were well lit and occupied throughout the day. The equity score, however, was low. Teenagers and young adults said the benches were often monopolised by older residents, and they felt unwelcome. The participation score was also low because the benches had been designed without consulting younger residents.
The city did not scale the pilot. Instead, it redesigned the seating layout, added a group of benches nearby, and ran a co design workshop with local youth groups. A second measurement cycle showed improved equity and participation scores. The pilot was then approved for expansion.
This story illustrates a crucial point. Social impact measurement is not about proving success. It is about learning what is actually happening on the ground.
How to build your own measurement toolkit
You do not need a massive budget to start measuring social impact. Amsterdam’s approach works at different scales. Here are the core tools you can adapt:
- A theory of change template – A one page document that maps inputs to activities to outcomes. Keep it simple. Use plain language.
- A five dimension scorecard – Print this out for every pilot. Score each dimension at baseline, midpoint, and endpoint.
- A resident feedback protocol – Standard questions you ask in every community session. This allows you to compare results across pilots.
- A log of unexpected outcomes – Create a space in your project management tool where team members can record things they did not anticipate. These often contain the most valuable insights.
For a deeper look at how Amsterdam structures its urban experiments, read our piece on how Amsterdam’s urban innovation ecosystem is accelerating sustainable city solutions in 2026. You might also find value in the article on 5 key performance indicators Amsterdam uses to measure smart city success.
The human element cannot be automated
Amsterdam has invested heavily in data platforms, digital twins, and automated dashboards. Yet the most important part of its social impact measurement remains stubbornly human. It is the conversation. The focus group. The walk through the neighbourhood where a resident points at a bench and says “nobody asked me about this.”
If you are building a smart city programme in your own city, start with that human element. Pick one pilot. Use the five dimensions. Talk to the people who live there. The numbers will follow.
Start measuring what actually matters
The temptation in smart city work is to measure what is easy. Energy consumption. Traffic counts. Device uptime. These things matter, but they are not the whole story. Amsterdam has shown that a more complete picture is possible. It requires a bit more effort at the start, a willingness to hear bad news, and a commitment to redesign when the scores tell you something is off.
Urban planners and policy makers in the UK face similar pressures. Housing targets, net zero deadlines, and budget constraints all push towards quick technical fixes. Amsterdam’s experience suggests a different path. Measure the social impact first. Let that guide the technology. The rest will fall into place.
If you want to see how this approach connects to broader urban strategy, take a look at our article on why Amsterdam’s smart city initiatives prioritise citizen wellbeing over technology. It explains the philosophy behind the framework and how it shapes investment decisions across the city.
Next time you launch a pilot, try the five dimension scorecard. Score it honestly. Share the results with the community. And be ready to change course. That is how you measure the true social impact of a smart city.
About the Author