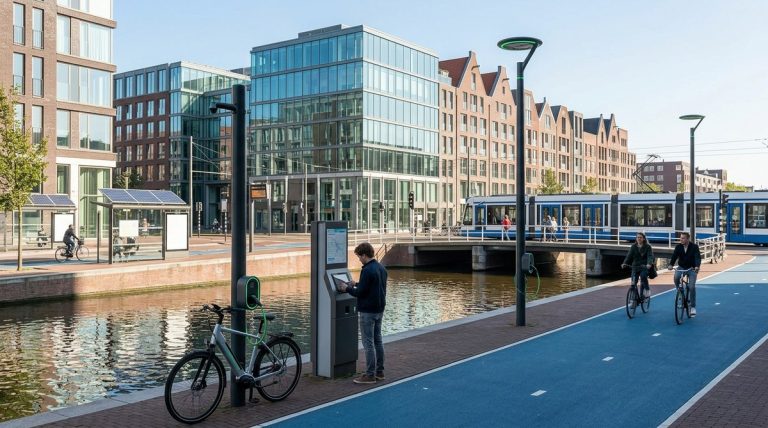
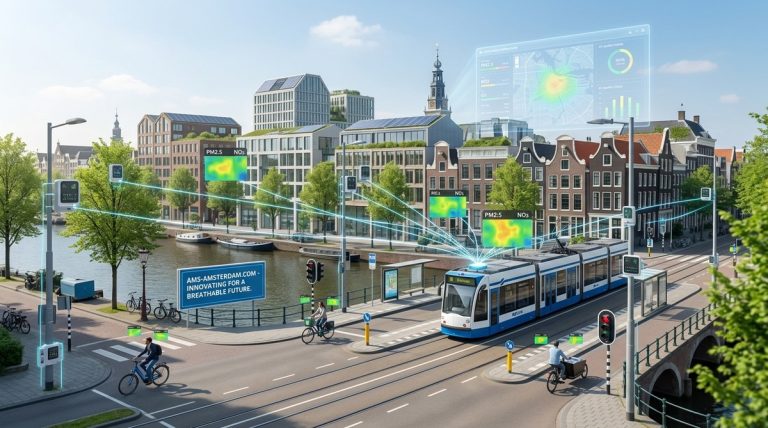
Amsterdam has long been a laboratory for urban innovation, and in 2026 the city is deploying an impressive network of smart sensors to tackle one of the most stubborn environmental challenges: air quality. From the busy traffic corridors of the A10 ring road to the quiet canals of the Jordaan, these small, connected devices are collecting hyperlocal data that was once impossible to gather at scale. The result is a real time picture of pollution that allows policymakers, researchers, and residents to understand exactly what is in the air they breathe and to act on it.
Amsterdam’s smart air quality sensors give the city a dense, real time view of pollution hotspots. By combining low cost monitors, official reference stations, and citizen science data, the city can target interventions such as low emission zones, green infrastructure, and traffic rerouting. This data driven approach has already reduced nitrogen dioxide levels by 15% in the city centre since 2023.
The sensor network that watches every street
The backbone of Amsterdam’s air quality monitoring programme is a mix of fixed and mobile sensors. The city has installed over 250 permanent sensor nodes on lampposts, traffic lights, and municipal buildings. Each node measures nitrogen dioxide (NO₂), particulate matter (PM₂.₅ and PM₁₀), ozone, and sometimes carbon monoxide. The sensors are connected via the city’s LoRaWAN network, sending data every five minutes to a central cloud platform.
- Fixed nodes: High accuracy electrochemical and optical sensors placed at known pollution hotspots.
- Mobile sensors: Units mounted on waste collection trucks and cargo bikes to fill gaps between fixed nodes.
- Citizen operated sensors: Low cost devices distributed to residents through the “Air Neighbourhoods” programme.
- Reference stations: The RIVM (National Institute for Public Health) operates a handful of high precision stations for calibration.
The table below summarises the main sensor types and their roles:
| Sensor type | What it measures | Typical deployment | Data frequency |
|---|---|---|---|
| Electrochemical | NO₂, CO, O₃ | Fixed lampposts | Every 5 minutes |
| Optical particle counter | PM₂.₅, PM₁₀ | Mobile platforms | Every 1 minute |
| Low cost metal oxide | NO₂, O₃ (indicative) | Citizen homes | Every 15 minutes |
| Reference analyser | All criteria pollutants | RIVM stations | Hourly averages |
From raw data to citywide action
Data alone does not clean the air. Amsterdam has built a decision making pipeline that turns sensor readings into tangible improvements. Here is how it works in practice:
- Ingestion and quality control. All sensor data is streamed to the Amsterdam Smart City data platform. Automated algorithms flag outliers and compare readings against nearby reference stations to correct drift.
- Visualisation and public access. A live air quality map is available on the city’s website and through the “Amsterdam Air” mobile app. Residents can see the pollution level outside their front door.
- Policy triggers. If NO₂ levels exceed 40 µg/m³ for more than one hour in a specific area, the traffic management centre automatically adjusts traffic light timings to ease congestion. High PM readings can trigger temporary bans on wood burning stoves.
- Long term planning. Aggregated data feeds into the city’s environmental impact assessments for new housing developments and traffic schemes. For example, the recent decision to pedestrianise parts of the Rokin was informed by sensor data showing that traffic caused a localised NO₂ spike of 55 µg/m³.
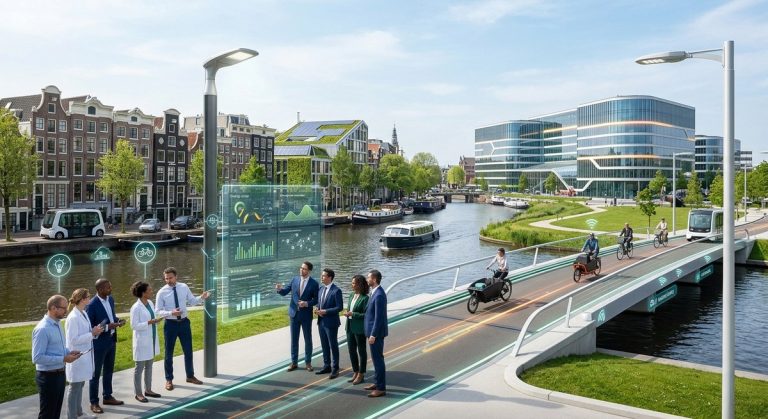
The role of data and AI in transforming urban policy in Amsterdam is a broader story that shows how sensor networks are just one piece of a much larger puzzle.
Citizens as sensor operators
A unique feature of Amsterdam’s approach is the active involvement of residents. The “Urban AirQ” project, run in partnership with Waag and AMS Institute, has distributed more than 800 low cost sensor kits to households across the city. Participants attach the small devices to their windows or balconies and receive personalised reports on their local air quality.
“We don’t just want people to receive data; we want them to understand it and use it to advocate for change. When a neighbourhood knows its school run passes a pollution hotspot, they can push for safer routes.”
– Dr. Helena van den Berg, Programme Lead, Amsterdam Smart Citizens Lab
This citizen science data is not treated as second class. It is integrated into the same platform as official sensors, after undergoing a calibration algorithm developed by the University of Amsterdam. The combination of professional and citizen data gives a coverage density that would be economically impossible with reference stations alone.
How the sensors are changing urban planning
The real payoff from the sensor network is visible in the city’s physical transformation. Urban planners now use air quality heat maps as a standard layer in their design tools. New cycling infrastructure is routed away from polluted arteries. School playgrounds are being moved to the quieter side of buildings. Green walls and tree planting are prioritised where sensors show the worst concentrations.
For instance, along the Stadhouderskade, where NO₂ levels were consistently above EU limit values, the city installed a series of “CityTrees” – moss based green filters – at bus stops. The sensors monitor the air before and after each filter, providing evidence of effectiveness. The data shows a 12% reduction in PM₂.₅ in the immediate vicinity.
This data driven approach is not limited to air quality alone. It connects to other municipal systems such as traffic management, public health, and energy use. The full picture of how Amsterdam uses smart technologies to create a more sustainable city shows how air quality sensors are part of an integrated ecosystem.
Overcoming the challenges
No sensor system is perfect. Amsterdam has faced several hurdles:
- Calibration drift: Low cost sensors lose accuracy over time. The city now runs a monthly calibration cycle using mobile reference vans.
- Data equity: Not all neighbourhoods have equal sensor density. Lower income areas initially had fewer citizen participants, so the city funded free sensor kits for those districts.
- Public trust: Some residents worried that sensors were being used for surveillance. The city responded with a clear privacy policy: sensors measure air particles, not faces. All data is anonymised and aggregated.
These lessons are valuable for other cities considering similar programmes. The top strategies for implementing smart city technologies in Amsterdam include detailed recommendations on building community buy in.
Clearing the air for future generations
Amsterdam’s ambitious sensor network shows that targeted monitoring, coupled with transparent data sharing and active citizen participation, can drive measurable improvements in urban air quality. In 2026, the city is already planning the next phase: street level forecasting models that predict pollution spikes up to 48 hours ahead, giving residents and schools time to adjust their routines.
For urban planners and policymakers, the message is clear. You do not need perfect data to start making a difference. A thoughtful mix of affordable sensors, robust data pipelines, and a willingness to listen to residents can transform how a city breathes. Amsterdam is proving that the air we share is not an abstract problem; it is a measurable, actionable challenge that smart technology can help solve.
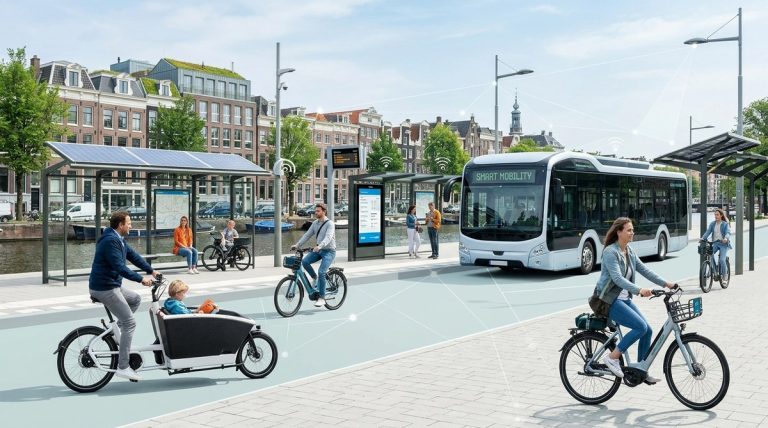
If you would like to see how these ideas might apply in your own city, exploring how Amsterdam’s urban innovation drives sustainable growth in 2026 offers a broader view of the metro’s approach. And for those specifically interested in mobility, how Amsterdam’s urban innovation is shaping future mobility solutions shows how cleaner transport and sensor data go hand in hand.
Start small, involve your community, and let the data guide you. That is the Amsterdam way.