Manchester hit 38 degrees in July 2022. London reached 40.3. Those were not just record breaking figures. They were warnings. Concrete, tarmac, and dark roofing absorb the sun’s energy during the day and release it slowly at night. That trapped heat creates a dome of higher temperatures over built up areas. We call it the urban heat island effect. For UK planners and climate officers, the challenge is no longer theoretical. It is a matter of public health, energy demand, and social equity. The question is where to intervene first. That is where urban heat island mapping UK becomes the most powerful tool in your adaptation kit.
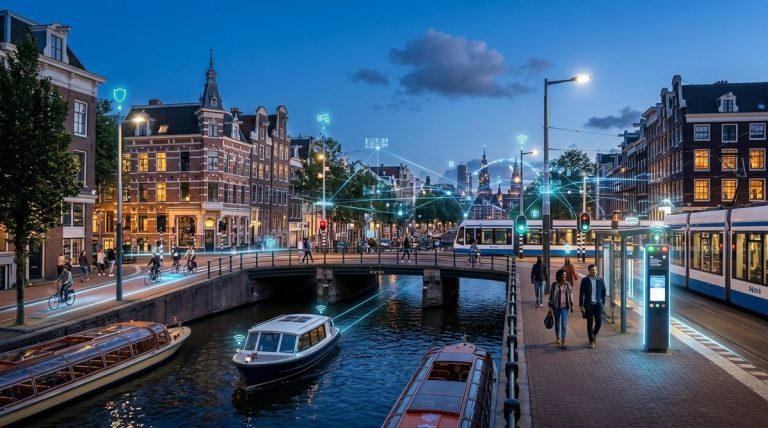
Amsterdam’s heat island mapping programme combines satellite thermal data, ground level sensors, and citizen reports to create hyperlocal heat risk profiles. UK cities can adopt this layered approach without massive budgets. The key is starting small, using open data, and targeting the most vulnerable neighbourhoods first. Mapping is not the end goal. It is the foundation for smarter cooling interventions.
Why UK cities need heat island mapping right now
The UK is warming faster than the global average. Heatwaves that used to arrive once a decade now appear every two to three years. Dense urban areas suffer most. Birmingham’s city centre can be 6 degrees warmer than its rural edges. Glasgow’s tenement blocks trap heat overnight, keeping indoor temperatures dangerously high. Vulnerable residents in tower blocks, elderly people in flats without cross ventilation, and low income households without air conditioning bear the worst of it.
Mapping tells you exactly where those hotspots sit. It shows you which streets turn into ovens at 4pm. It reveals which parks cool the surrounding blocks and which car parks radiate heat into nearby homes. Without a map, you are guessing. With a map, you can prioritise tree planting, reflective surfaces, and green corridors where they will save lives.
How Amsterdam built its heat island map
Amsterdam started with a simple question. Which parts of the city get hottest on a 30 degree day? The city’s approach combined three data layers.
- Satellite thermal imagery from Landsat and Sentinel programmes. These satellites measure surface temperature at 30 metre resolution. Amsterdam ran the data for multiple summer days and averaged the results.
- Ground level sensor networks placed on lampposts and bus shelters. These record air temperature, humidity, and wind speed every ten minutes. The sensors cost roughly 200 pounds each.
- Citizen science reports collected through a mobile app. Residents logged how their street felt at different times of day. This added a lived experience layer that satellites cannot capture.
The city then overlaid demographic data. It mapped heat risk against age, income, and building type. The result was a heat vulnerability index for every neighbourhood. You can see the full story in our article on how Amsterdam uses smart technologies to create a more sustainable city.
A practical process for UK local authorities
Your council does not need Amsterdam’s budget. You can start with free data and low cost sensors. Here is a step by step process that works for UK towns and cities.
- Download open satellite data from the UK Space Agency or the European Space Agency’s Copernicus programme. Look for Land Surface Temperature datasets for your local authority area. Pick three to five cloud free summer days from the last two years.
- Validate with ground truthing. Walk the hottest streets with a handheld infrared thermometer. Note surface types: asphalt, concrete, grass, water. Compare your readings to the satellite data.
- Add wind and shade layers. Use local weather station data for prevailing wind direction. Map building shadows using a simple GIS tool. South facing streets with no tree cover will be your worst hotspots.
- Overlay vulnerability data. Match your heat map to Index of Multiple Deprivation data, age profiles, and housing type. This tells you where risk is highest, not just where temperature is highest.
- Publish a public facing map. Make it interactive. Let residents see their own street. This builds awareness and support for interventions.
Common mapping mistakes and how to avoid them
Even well intentioned mapping projects can go wrong. Here are the most frequent errors and the fixes that work.
| Mistake | Why it happens | How to fix it |
|---|---|---|
| Using only one satellite image | A single snapshot misses local weather patterns | Average at least five dates across different summers |
| Ignoring wind direction | Still air amplifies heat; wind corridors cool streets | Include prevailing wind data in your model |
| Mapping at city scale only | Neighbourhood level variation gets lost | Map at ward or LSOA level (roughly 1,500 people) |
| Forgetting night time temperatures | Daytime maps miss the most dangerous hours | Include dawn and dusk satellite passes |
| Not validating with locals | Maps can miss microclimates like courtyard heat traps | Run a citizen reporting campaign for one summer |
What the data tells you next
Once you have a reliable map, the real work begins. The map becomes a decision making tool. It tells you where to plant trees first. It shows which streets need cool pavements. It identifies schools and care homes that need shading or green roofs.
Amsterdam used its map to target 10,000 new trees in the hottest wards. It installed green roofs on 20 municipal buildings in the most exposed areas. It redesigned three public squares to include water features and permeable surfaces. The city measures success by comparing repeat satellite images year on year. Surface temperatures in the treated areas dropped by an average of 2.5 degrees within three years.
UK cities are starting to follow. Manchester’s city council used heat mapping to prioritise 500 new street trees in Moss Side and Hulme. Bristol identified 12 primary schools in the hottest zones and installed shade sails and green play areas. Glasgow mapped its tenement blocks and targeted insulation upgrades to flats that faced south and west. These are early wins that build momentum.
“You cannot manage what you do not measure. Heat mapping gives us the evidence to justify spending on green infrastructure. It moves the conversation from ‘nice to have’ to ‘essential investment’.”
* Dr. Elena Ristik, Senior Climate Adaptation Officer, Greater Manchester Combined Authority
Tools and data sources for UK practitioners
You do not need expensive software to start. Here are the most accessible resources available right now.
- UKCEH Land Cover Map at 25 metre resolution. Free for public sector use. Shows green cover, impervious surfaces, and water bodies.
- Met Office MIDAS weather station data. Hourly air temperature records for hundreds of UK stations. Useful for ground truthing.
- OS OpenData building footprints and road networks. Combine with satellite data to understand heat exposure by building type.
- Copernicus Urban Atlas for 2026. New high resolution land use data specifically designed for urban climate analysis.
- Local Authority Energy Planning datasets held by your own council. Often include building age, insulation levels, and fuel poverty data.
For a deeper look at how data transforms urban policy, read our piece on the role of data and AI in transforming urban policy in Amsterdam.
Building a heat resilient neighbourhood
Mapping is only useful if it leads to action. Here are the interventions that UK cities are deploying based on their heat maps.
- Green corridors along main roads. Trees planted on bus routes reduce heat exposure for waiting passengers. They also cut indoor temperatures in adjacent flats.
- Cool roofs on council housing. White or reflective coatings on flat roofs can lower indoor temperatures by 3 to 4 degrees. Several housing associations in London are trialling this now.
- Pocket parks in heat islands. Small green spaces the size of a tennis court can cool the surrounding 100 metres by 1.5 degrees. They also improve drainage and mental health.
- Shaded play areas. Rubberised surfaces absorb less heat than asphalt. Combined with shade sails, they keep playgrounds usable during heatwaves.
- Water features in public squares. Misting stations and fountains create localised cooling. They work best when placed at the end of wind corridors.
A blueprint for national coordination
UK cities face a shared problem. But most are mapping in isolation. That leads to duplicated effort and inconsistent data. A national heat island mapping framework would save money and create a baseline for tracking progress over time.
Amsterdam’s approach offers a template. The city publishes its heat map as open data. Other Dutch cities use the same methodology. That allows comparison between Utrecht, Rotterdam, and The Hague. It also lets smaller towns skip the research phase and jump straight to action.
The UK could do the same. A standardised mapping protocol, agreed by the Met Office, UKHSA, and local government, would give every council a level playing field. Central government could fund the satellite data processing. Local authorities would add their own ground truthing and vulnerability layers. The result would be a national heat risk atlas updated every two years.
From map to mandate
The most important shift is cultural. Heat mapping should not be a one off research project. It should be a routine part of urban planning. Every new development should include a heat impact assessment. Every local plan should identify heat risk zones. Every transport scheme should consider shade and surface reflectivity.
Some UK councils are already embedding heat mapping into their planning process. Brighton and Hove requires new developments to demonstrate that they will not worsen local heat islands. Leeds uses its heat map to reject planning applications that would remove mature trees in hotspot areas. These are early examples of mapping moving from the GIS team to the planning committee.
Your first step this week
You do not need a full strategy document to start. Here is what you can do in the next five working days.
- Download the free Land Surface Temperature data for your area from the Copernicus Data Space Ecosystem.
- Open it in QGIS (free) or Google Earth Engine (free for public sector).
- Identify the five hottest pixels in your city. Those are approximately 900 square metre areas each.
- Visit those locations. Take photos. Note the surface materials and the presence or absence of shade.
- Share the images with your climate adaptation team. Ask them one question: what would it take to cool this spot by 2 degrees?
That small step will start a conversation. It will build momentum. And it will show that urban heat island mapping UK is not a distant academic exercise. It is a practical, affordable, and urgent tool for making our cities safer in a warming world.
For more inspiration on how other cities are tackling climate challenges through innovation, look at what can UK cities learn from Amsterdam’s smart city success. The methods are transferable. The time to act is now.
About the Author