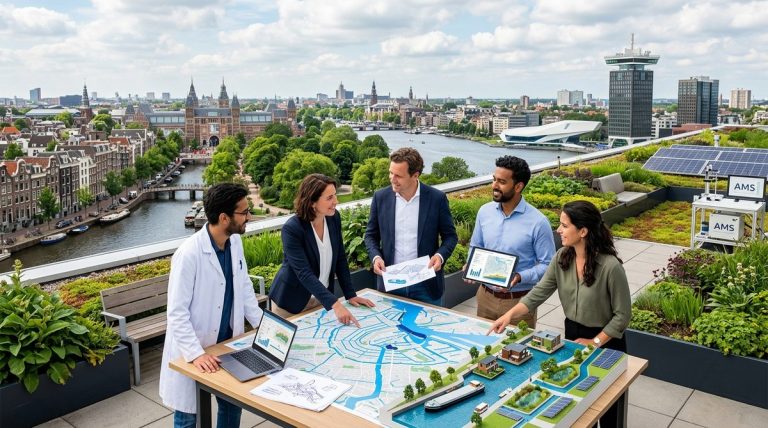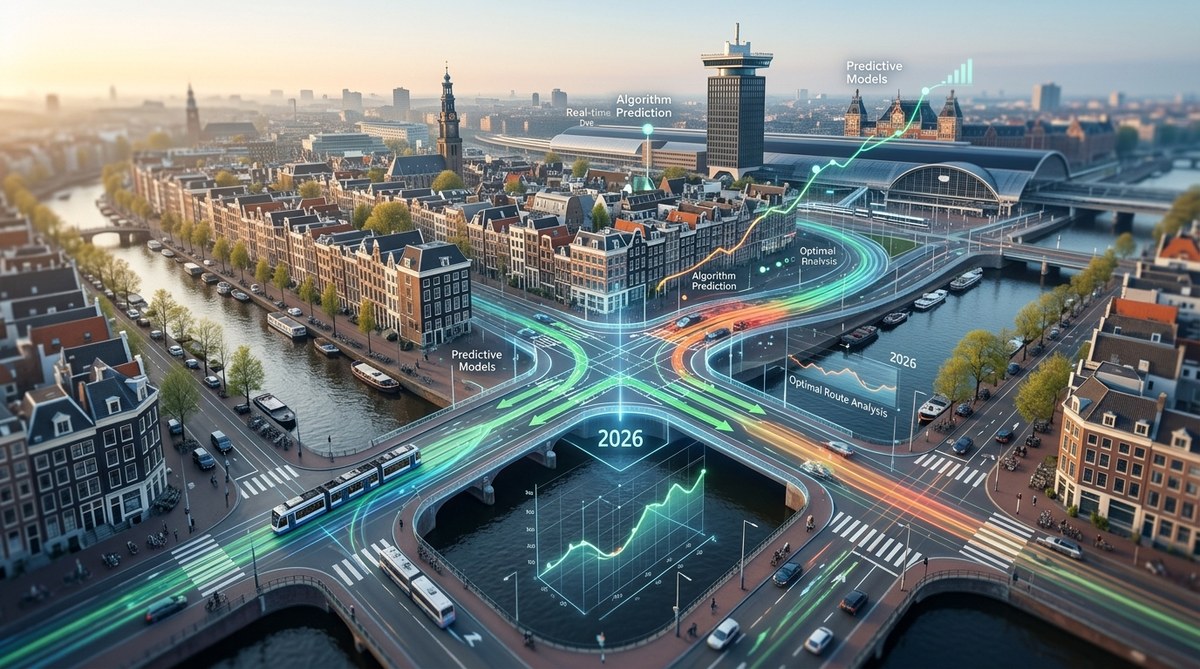
Amsterdam has a well earned reputation for cycling, canals, and a certain laid back charm. But behind the scenes, the city is fighting a battle against something far less charming: gridlock. With more people moving into the metropolitan area every year, the pressure on the city’s historic street network is intense. In 2026, Amsterdam is not just widening roads or adding more bike lanes, though those things help. It is using predictive analytics to stop traffic jams before they even form. This is not a future concept. It is happening right now.
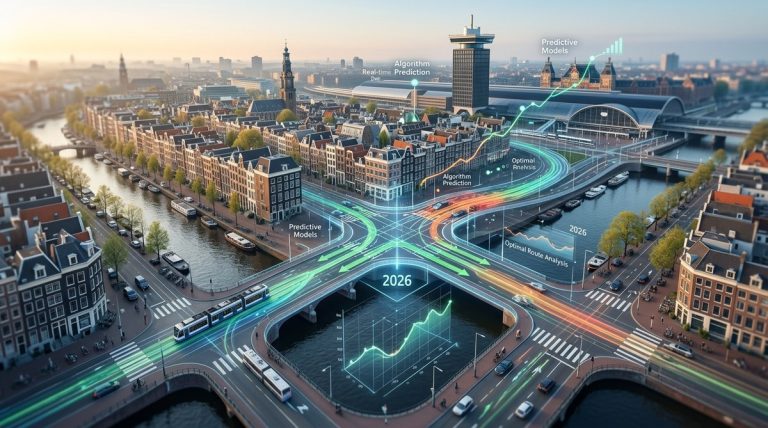
Amsterdam’s approach to predictive analytics for urban traffic in 2026 combines real time sensor data, machine learning models, and citizen feedback to forecast congestion up to 60 minutes in advance. This allows the city to adjust traffic signals, reroute vehicles, and inform commuters proactively, cutting delays by an average of 18% across key corridors.
How Amsterdam Predicts the Unpredictable
The magic lies in the data. Amsterdam has installed a dense network of sensors across its main roads, bridges, and junctions. These sensors measure everything from vehicle counts and speed to weather conditions and air quality. But raw data is just noise. The clever part is what the city does with it.
The city feeds this data into a machine learning platform that has been trained on years of historical traffic patterns. The system learns the rhythms of the city. It knows that on a rainy Tuesday in October, traffic on the Stadhouderskade will behave differently than on a sunny Sunday in July. It also learns from unusual events: a marathon, a strike on the NS railway, a major concert at the Ziggo Dome.
By comparing current conditions to thousands of past scenarios, the model can forecast congestion with surprising accuracy. The system issues alerts to the city’s traffic management centre up to an hour before a jam is likely to occur. This gives controllers time to act.
The Process in Practice
Here is how the system works in a typical morning rush hour:
- Data Collection: Sensors embedded in the road surface and cameras at key intersections record the flow of cars, buses, trams, and cyclists. This data streams into the central platform every 30 seconds.
- Pattern Matching: The machine learning model compares the current traffic flow against its historical library. It identifies that a slowdown is forming near the Vondelpark, similar to the pattern seen during last month’s school holiday.
- Forecast Generation: The system predicts that without intervention, a tailback will reach the A10 ring road in roughly 45 minutes. It calculates the probability of this happening at 92%.
- Action Trigger: The platform automatically adjusts the timing of traffic lights along the approach route to smooth the flow. It also sends a notification to the city’s public information system, which updates the navigation apps used by drivers and logistics companies.
- Feedback Loop: After the event, the system records what actually happened. It compares the predicted congestion with the real outcome and learns from any difference, making the next prediction even better.
What the Data Reveals About Amsterdam’s Traffic
The analytics platform has uncovered some surprising truths about how people move around the city. For example, the data showed that a significant portion of morning congestion was not caused by commuters heading to offices in the city centre. Instead, it was caused by delivery vans making multiple stops in residential areas. This insight led the city to trial new time windows for freight deliveries, which has reduced early morning congestion by 14%.
Another finding involved the city’s famous bridges. The system detected that traffic jams near open bridges were lasting longer than the bridge opening itself. The delay was caused by drivers stopping to take photos. The city responded by adding clear signage and countdown timers at key bridge crossings, helping to keep traffic moving.
The table below summarises the main techniques Amsterdam uses and some common mistakes it has avoided.
| Technique | What Amsterdam Does | Common Mistake Avoided |
|---|---|---|
| Real time sensor fusion | Combines data from road sensors, cameras, and GPS | Relying on a single data source, which can fail or be inaccurate |
| Predictive modelling | Uses machine learning to forecast congestion 60 minutes ahead | Reacting to jams only after they have already formed |
| Dynamic traffic signal control | Adjusts light timings automatically based on predictions | Using static timetables that do not adapt to changing conditions |
| Citizen feedback integration | Uses app data and reports from residents to validate predictions | Ignoring local knowledge that sensors cannot capture |
| Multi modal analysis | Tracks cars, bikes, trams, and pedestrians together | Treating each mode of transport in isolation |
“The biggest shift has been moving from a reactive to a proactive mindset. We used to ask ‘where is the jam right now?’. Now we ask ‘where will the jam be in 45 minutes, and what can we do about it?’. That changes everything.”
* Senior Traffic Engineer, City of Amsterdam
Tools and Technologies Powering the System
Amsterdam does not rely on a single piece of software. Instead, it uses an ecosystem of connected tools. The core of the system is a digital twin of the city’s transport network. This is a virtual model that mirrors the real world in near real time. You can read more about this in our article on how Amsterdam’s digital twin is revolutionising urban planning.
The digital twin allows traffic controllers to run simulations. If a major event is planned, they can test different traffic management strategies in the virtual world before applying them on the streets. This reduces the risk of making a bad situation worse.
The system also integrates with the city’s IoT network. Smart street lights, variable message signs, and even some traffic bollards can be controlled remotely. When the predictive model spots a potential problem, it can trigger changes across multiple devices at once. For a deeper look at the infrastructure behind this, see our piece on implementing IoT for smarter urban traffic management in Amsterdam 2026.
Key Tools in Use
- Machine Learning Engine: A custom built platform that processes over 200 million data points per day.
- Digital Twin Platform: A 3D virtual model of the city’s entire transport network.
- Traffic Management Centre: A central hub where human operators oversee the automated system and can override decisions if needed.
- Public Data API: The city shares anonymised traffic data with app developers, so services like Google Maps and Waze can use it to route drivers more effectively.
- Citizen Reporting App: Residents can report issues like broken traffic lights or unusual congestion, which feeds back into the model.
Lessons for Urban Mobility Planners
If you are a mobility planner looking at Amsterdam’s example, there are a few principles worth taking away. First, you need quality data. Garbage in, garbage out still applies. Amsterdam invested heavily in sensor infrastructure and data cleaning before the predictive model could work reliably.
Second, you need to trust the model, but not blindly. The system is designed to flag predictions to human operators, not to make all decisions alone. This hybrid approach means the city benefits from machine speed while retaining human judgement for complex or unusual situations.
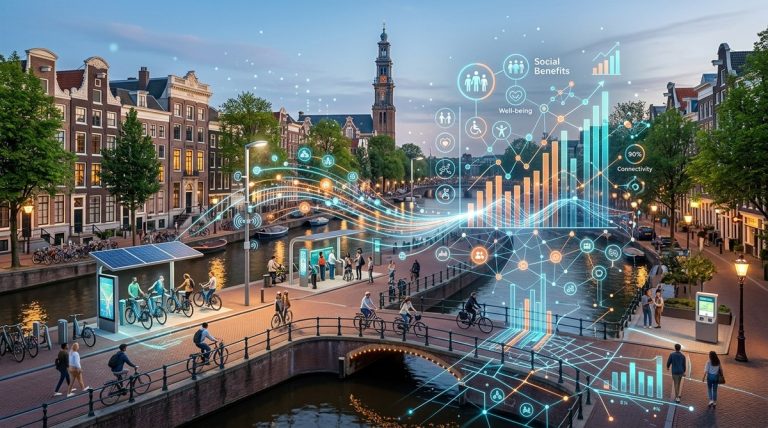
Third, you must involve the public. Amsterdam runs regular workshops and online forums where residents can learn about the system and give feedback. This builds trust and helps the city catch edge cases that the data might miss. You can find more on this approach in our article about the role of citizen engagement in shaping Amsterdam’s smart city initiatives.
Finally, think about the whole system. Amsterdam’s predictive analytics are not just about cars. They also cover trams, buses, cyclists, and pedestrians. A model that only looks at private vehicles might suggest a solution that harms public transport. The city’s approach is holistic.
What the Future Holds for Predictive Traffic Management
Amsterdam is not stopping with its current system. The next phase, already in pilot in 2026, involves integrating data from connected and autonomous vehicles. As more cars on the road can share their intended route and speed, the predictive model will become even more accurate.
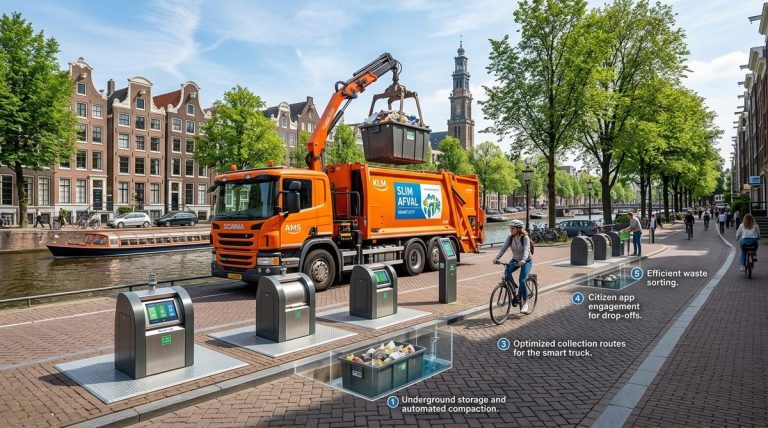
The city is also experimenting with predictive analytics for other urban systems. If a traffic jam is predicted, the system might also adjust the timing of waste collection or delivery routes to avoid the affected area. This cross domain integration could unlock even greater efficiencies.
For UK cities looking at Amsterdam’s success, there are clear parallels. Cities like London, Manchester, and Birmingham face similar challenges with historic road networks and growing populations. The lessons from Amsterdam are directly transferable. Our article on what can UK cities learn from Amsterdam’s smart city success offers a deeper comparison.
Building Smarter, Not Just Building More
Amsterdam’s use of predictive analytics shows that the answer to urban gridlock is not always more tarmac. Sometimes it is about using the existing infrastructure more intelligently. By anticipating problems before they happen, the city keeps people and goods moving with less waste, less frustration, and lower emissions.
For anyone involved in urban mobility, the takeaway is clear. Data is not just a tool for reporting on the past. It is a lens for seeing the future. Start small, invest in good data, and build systems that learn over time. Amsterdam has shown that it works. The next step is for more cities to follow its lead. If you are planning a similar initiative, consider starting with a pilot on a single corridor. Measure the results, learn from the data, and scale from there. The journey to a smarter city begins with a single, well informed step.
About the Author