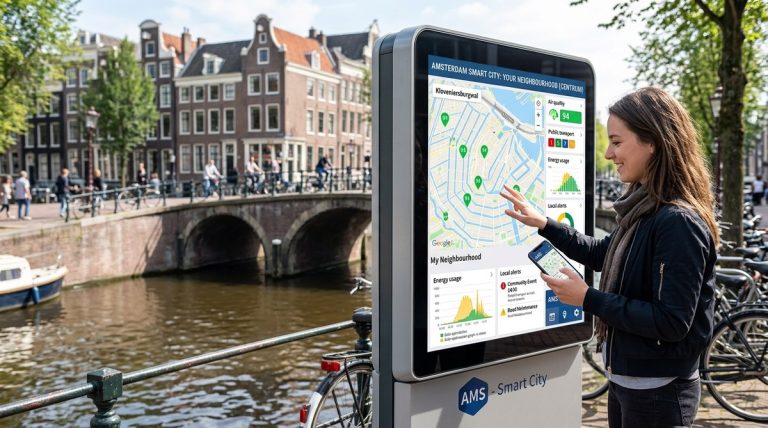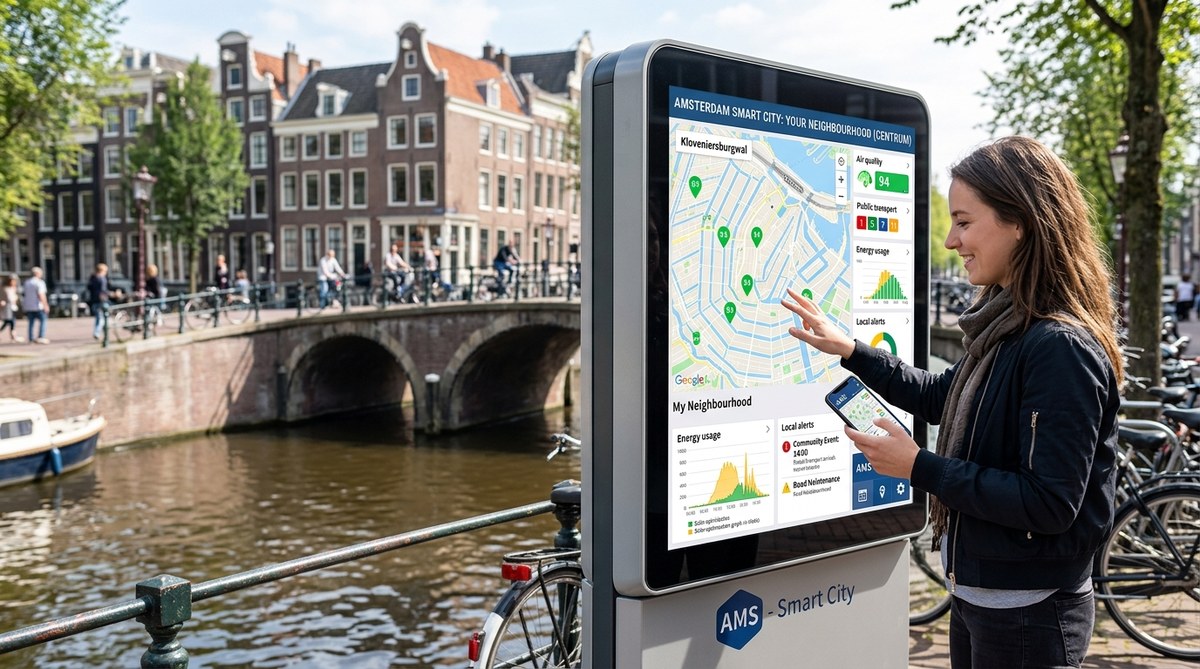
Picture this: you are standing on a street in Amsterdam. The bins are full, the traffic is snarled, and the air feels thick. In most cities, you would wait weeks for a council report. In Amsterdam, you can pull out your phone and see exactly what is happening right now. The city’s smart city dashboard is not a distant control room. It is a live, open window into every neighbourhood. And the best part? You get to act on what you see.
Amsterdam’s smart city dashboard puts real-time data into the hands of residents, not just officials. Citizens can monitor air quality, traffic, waste levels, and energy use street by street. This transparency shifts power from the town hall to the pavement. For urban planners, it offers a blueprint for participatory governance. For residents, it means their voice is backed by live evidence, turning complaints into collaborative action.
A Dashboard That Speaks Your Street’s Language
The Amsterdam smart city dashboard is not a single screen. It is a network of sensors, cameras, and public data feeds that update every few minutes. You can check the noise level on your canal at midnight. You can see how full the underground bins are before you walk three blocks. You can watch the traffic flow adjust after a festival lets out.
This is not a gimmick. It is a fundamental shift in how a city communicates with its people. Instead of waiting for a quarterly report, you get a live feed. Instead of guessing which street needs resurfacing, you see the data. The dashboard makes the invisible visible. And that visibility is the first step toward real control.
What Can You Actually See?
The dashboard covers several layers of city life. Here is a breakdown of the main categories:
| Category | What is Measured | How Often It Updates | Citizen Action Possible |
|---|---|---|---|
| Air quality | Nitrogen dioxide, particulate matter | Every 5 to 15 minutes | Suggest low-traffic school routes |
| Waste management | Fill level of underground bins | Real time | Report overflow or plan a recycling trip |
| Traffic and mobility | Vehicle count, bike flow, parking spots | Every minute | Choose a less congested cycle path |
| Noise pollution | Decibel levels at specific hotspots | Every 10 minutes | Request a quiet zone near a park |
| Energy use | Grid load, solar generation per district | Every 15 minutes | Shift laundry or charging to off-peak hours |
Each category is shown on a map of Amsterdam. You can zoom into your own street. You can compare your block with the next one. This is hyper-local data, and it is yours to use.
How Citizens Use the Dashboard in Practice
You might wonder: what does a person actually do with this information? The answer is simpler than you think. Here are three real ways residents are taking control.
-
Report with evidence. A resident in De Pijp noticed the air quality was bad near a primary school. Instead of a vague complaint, she took a screenshot of the dashboard showing high nitrogen dioxide levels at pickup time. She sent it to the local borough council. Within a month, the council rerouted delivery trucks away from that street during school hours.
-
Organise local action. A group in Noord saw that their neighbourhood bins were consistently full by Wednesday evening. They used the dashboard data to petition for an extra collection day. The council agreed, and the data proved the need.
-
Change personal behaviour. A family in Oost used the energy grid data to run their washing machine and dishwasher after 10pm, when demand was lower. Their electricity bill dropped by twelve percent in three months.
These are not tech experts. They are ordinary Amsterdammers who saw a number on a screen and decided to act. The dashboard lowers the barrier to participation. You do not need to be a data scientist. You just need to care about your street.
“The dashboard turns residents into partners. It gives them the same information we have. That changes the conversation from ‘you should fix this’ to ‘how can we fix this together?'” – Local borough official, Amsterdam Zuidoost
The Role of Real-Time Data in Urban Planning
For urban planners, the dashboard is a goldmine. But it is a goldmine that citizens can also dig into. This shared visibility creates a new kind of accountability.
Consider traffic management. In the past, a planner would commission a study, wait six months for results, and then propose changes. By then, the problem might have moved. With the dashboard, you can see congestion forming in real time. You can test a temporary cycle lane on a Tuesday and see the impact by Friday.
The same applies to how Amsterdam uses smart technologies to create a more sustainable city. The dashboard feeds directly into the city’s broader sustainability goals. When residents shift their energy use based on live grid data, the whole system becomes more efficient. It is a virtuous circle: data leads to action, action leads to better data.
Why This Matters for UK Urban Planners
If you work in a UK city, you may be thinking about how to replicate this. The good news is that Amsterdam’s approach is not expensive. It relies on existing sensors and open-source software. The key ingredient is not technology. It is trust. The city had to convince residents that the data would be used for good, not for surveillance.
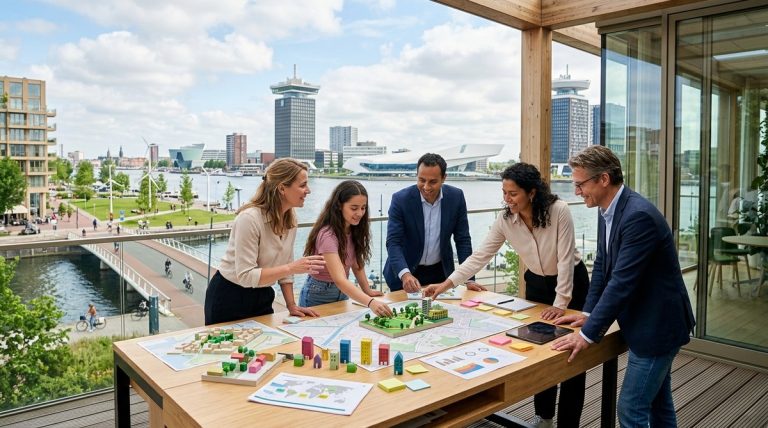
That trust is built through the role of citizen engagement in shaping Amsterdam’s smart city initiatives. The dashboard is not imposed from above. It was co-designed with neighbourhood groups. Residents helped decide which metrics mattered most. That is why they use it.
A Step-by-Step Guide to Starting Your Own Dashboard
If you are an urban planner or civic tech enthusiast, you might want to start small. Here is a practical process based on Amsterdam’s experience.
- Audit existing sensors. Most cities already have traffic counters, air quality monitors, and bin sensors. Find them. List what data they produce and how often.
- Choose one neighbourhood. Do not try to cover the whole city. Pick a district with an active residents’ association. Amsterdam started with a pilot in Nieuw-West.
- Co-design the interface. Show residents a prototype. Ask them what they want to see. Do they care about noise? Parking? Energy? Let them choose.
- Publish the raw data first. Do not wait for a polished dashboard. A simple map with live numbers is enough. Let people play with it.
- Create feedback loops. When a resident reports a problem using dashboard data, acknowledge it. Close the loop. Show them what changed.
- Iterate publicly. Release updates based on user requests. If people want historical trends, add them. If they want alerts, build them.
This approach mirrors top 5 ways data-driven urban planning is transforming Amsterdam. It is iterative, open, and grounded in real need.
Common Missteps and How to Avoid Them
Building a citizen dashboard is not without pitfalls. Here are the most common mistakes, based on Amsterdam’s early trials.
- Data overload. Showing everything at once confuses people. Start with three or four metrics. Add more only when users ask for them.
- No context. A number like “45 decibels” means nothing without a reference. Show what is normal, what is high, and what action is recommended.
- Slow updates. If the data is a day old, people stop trusting it. Aim for updates every 15 minutes or less.
- Ignoring accessibility. The dashboard must work on a phone. Many residents will check it on the bus. Make it mobile-first.
The table below summarises the key techniques and mistakes.
| Technique | Why It Works | Common Mistake | Better Approach |
|---|---|---|---|
| Start with one neighbourhood | Builds trust and proves value | Trying to cover the whole city at once | Pilot, learn, then scale |
| Co-design with residents | Ensures relevance | Designing in a closed room | Hold open workshops |
| Use open data standards | Allows third-party apps | Locking data in a proprietary system | Publish as CSV or API |
| Provide context for numbers | Helps users understand | Showing raw figures without benchmarks | Add colour coding and alerts |
How the Dashboard Fits into Amsterdam’s Broader Smart City Vision
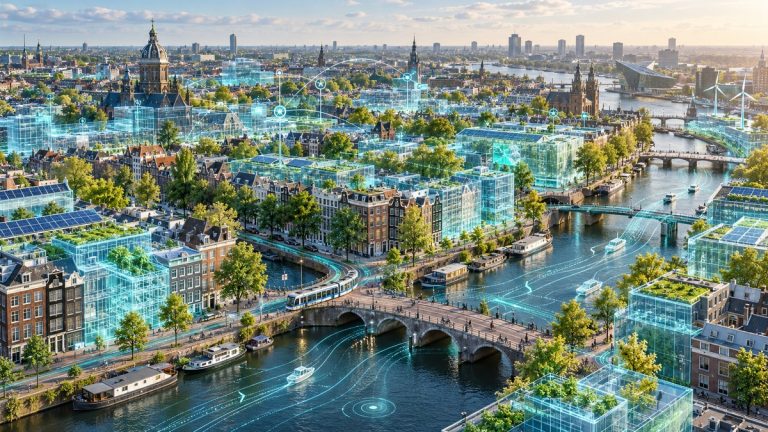
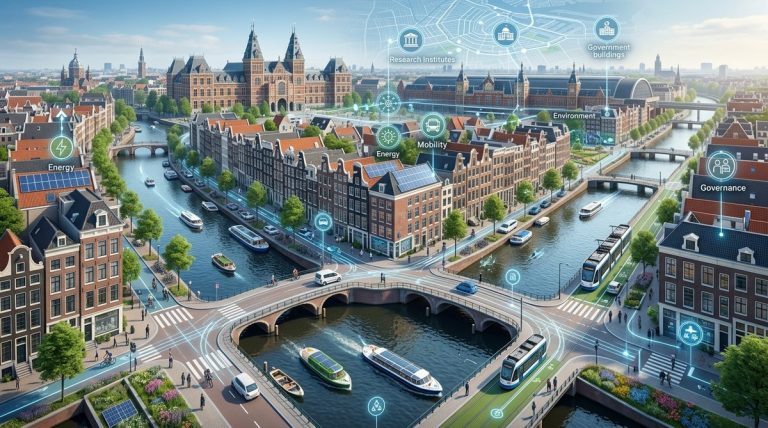
The dashboard is not a standalone project. It is part of a larger ecosystem. Amsterdam has invested heavily in innovative urban solutions shaping Amsterdam’s future in 2026. These include smart grids, digital twins, and citizen science labs. The dashboard ties them together.
For example, the city’s digital twin is a 3D model that simulates traffic, energy, and water flows. The dashboard lets residents see the same model in a simplified form. When a citizen reports a flooded street, the twin can model the best drainage solution. The dashboard then shows the repair progress in real time.
This integration is what makes the system powerful. It is not a collection of gadgets. It is a coherent platform where every piece speaks to the others. And the citizen is at the centre.
If you want to understand what makes Amsterdam a global leader in urban innovation, start with this dashboard. It is the most visible expression of a city that trusts its people.
A Warm Invitation to Try It Yourself
You can visit the Amsterdam smart city dashboard right now. It is public. You do not need a login. Pull it up on your phone and zoom into a random street. See the air quality. Check the bin levels. Watch the traffic flow.
Then ask yourself: what would I do with this data in my own neighbourhood?
That question is the starting point for every smart city. The technology is already here. The sensors are already in place. The only missing piece is the willingness to share control. Amsterdam has taken that leap. The results are visible, measurable, and deeply human.
If you are an urban planner, take this back to your team. If you are a civic tech enthusiast, build a prototype. If you are a local government official, start a conversation with your residents. The dashboard is not the end goal. It is the beginning of a more collaborative, more transparent, and more responsive city.
And that is something every neighbourhood deserves.
About the Author